Turn user engagement into predictable revenue growth
TL;DR Summary
The impact:
Strategic gamification transforms how users interact with your product. When mechanics align with core product behaviors, users form daily habits that directly impact revenue. The result: higher retention, lower churn, and increased lifetime value.
Why it works:
Gamification creates visible habit loops: Trigger → Action → Reward → Investment. When users see progress toward meaningful goals, they return consistently. This habit formation reduces churn and increases lifetime value. Every mechanic is tied to business metrics. We measure day-7 and day-30 retention, feature adoption, and LTV impact.
The business impact that matters
Measurable outcomes that directly affect revenue, churn, and growth.
- Higher LTV. Daily return patterns compound into 2–3× lifetime value.
- 40–60% less churn. Streaks and visible progress cut early-stage churn.
- Faster activation. Guided onboarding makes new users 3× more likely to stick.
Why gamification drives business results
When users see progress, they return. When they return, they form habits. Habits drop churn and grow LTV.
The habit loop that drives retention
Every successful product creates a loop: Trigger → Action → Reward → Investment. Gamification makes the loop visible.
- Trigger. Progress indicators remind users what's next.
- Action. Clear milestones guide users to complete key tasks.
- Reward. Visual feedback confirms success.
- Investment. Streaks and progress make leaving harder.
The metrics that matter
We don't track vanity metrics. We measure what moves the needle:
- Day-7 and Day-30 retention. Early habit formation.
- Feature adoption rate. How quickly users find value.
- Time to first value. Speed of activation.
- LTV increase. Long-term revenue impact.
The research is clear: meta-analyses from 2020–2023 show consistent positive effects on retention and engagement when mechanics are tied to core product tasks. Every mechanic must support a behavior that drives business value, not distract from it.
How to implement
Begin with a narrow scope: one key behavior that drives business value. Test behind a feature flag, measure impact in 2–4 weeks, then expand.
Achievements
Reward specific behaviors that drive business value. When users hit milestones, make the moment memorable with animated badge reveals.
Leaderboards
Create friendly competition by ranking users based on key metrics. Show top performers to motivate others while highlighting valuable behaviors.
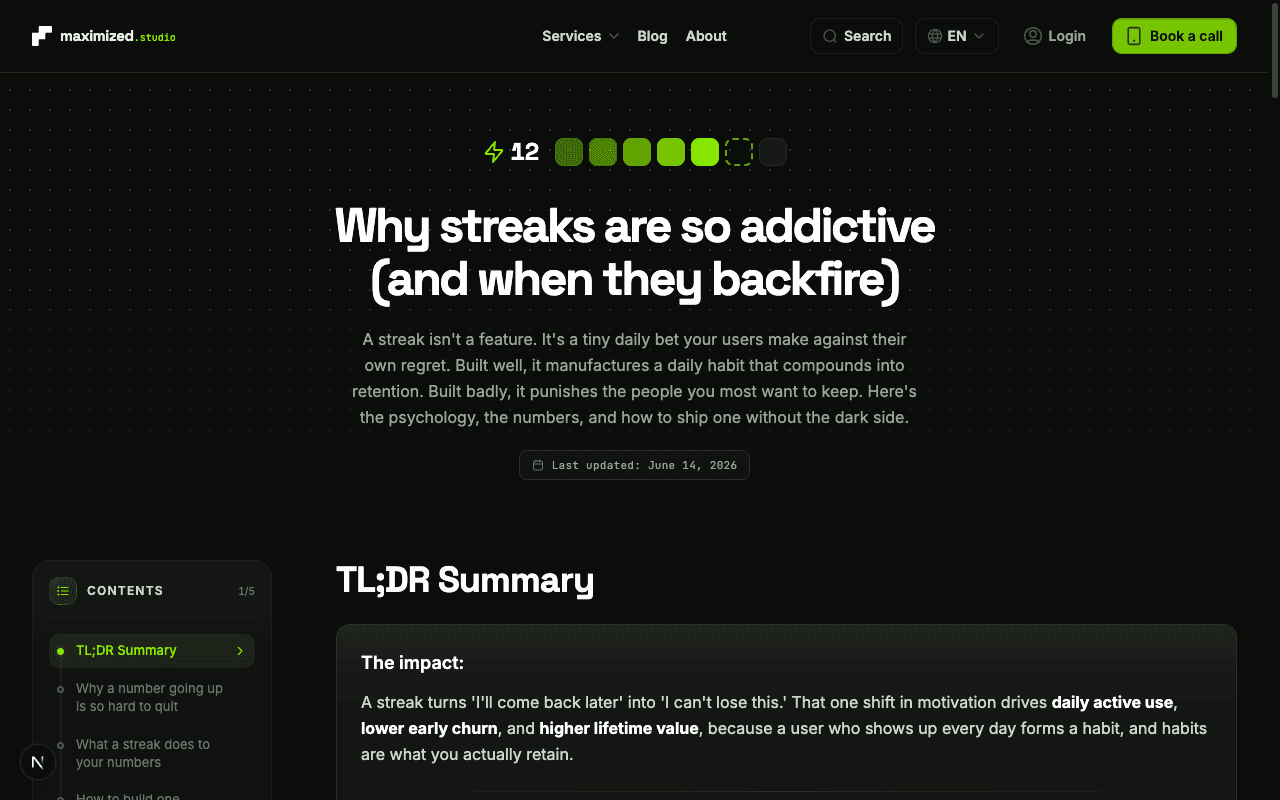
Daily streaks
Encourage daily return behavior by tracking consecutive days of activity. Visualize streaks with animated counters and milestone celebrations.
Progress bars
Show users how close they are to their next milestone. Visual progress creates anticipation and motivates completion.
Levels & XP
Give users a sense of progression through levels and experience points. Each level unlock feels like meaningful advancement.
Social challenges
Create group goals or challenges that encourage collaboration and shared achievement. Build community while driving engagement.
Key principle: every mechanic must align with a behavior that drives business value. Track the metric that matters: retention, feature adoption, or revenue. Iterate based on data, not assumptions.
Technical implementation
Two layers: a solid core system, plus an animated layer on top for maximum effect.
Core gamification system
The foundation: achievement models, progress schemas, streak logic, and milestone tracking. It works with or without animation, and includes server-driven flags for gradual rollout plus analytics stitched into events you already track. Start here, even if you skip the animation layer.
Rive-powered animated layer
Layered on top of the core system to amplify engagement. State machines connect UI state to animation logic, so success confirmations, progress thresholds, and achievement reveals all feel alive. Animated unlocks, confetti, dynamic gauges, and streak indicators are low-overhead, resolution-independent vectors. This is what turns a working system into one users actually want to come back to.
Why founders choose this approach
Built for speed, measured for impact, designed for scale.
- ROI-focused from day one. Every mechanic is tied to a business metric. Success criteria are defined up front and measured against your existing analytics.
- Fast to validate. Start narrow: one behavior, one audience. A/B test behind a flag and measure impact in 2–4 weeks before scaling.
- Quick to scale. Typical implementation takes 2–3 weeks to first results, then expands across behaviors and segments.
- Built for your stack. Works with your existing analytics, design system, and tech. Rive animations and UI components ship ready to integrate.
Related Articles
Back to Blog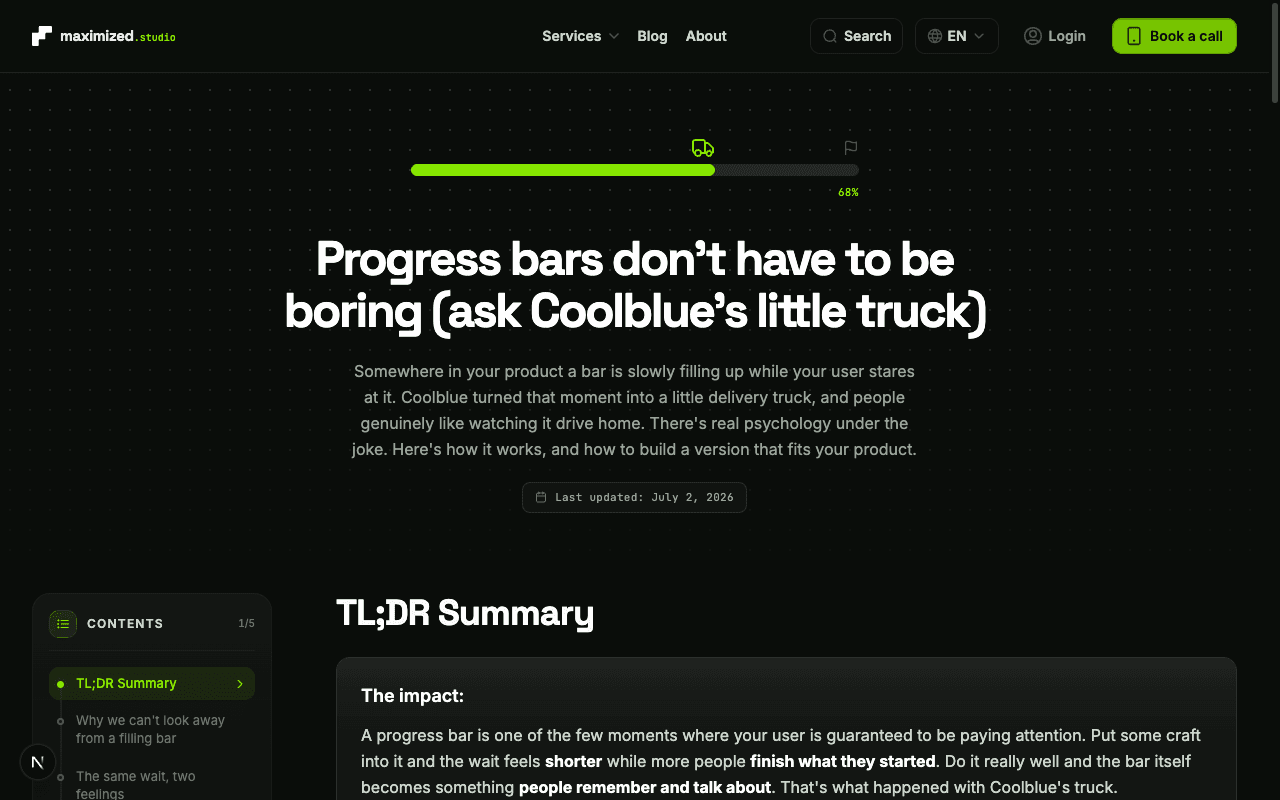
Ready to deliver more value?
We build the apps, automations, and workflows behind your business, so less time goes to managing, and more goes to delivering.
